Examination Questions in Data Interpretation - 9
Click on the Show Answer button to see the answer.
I. The bar graph, given below, shows the number of tickets sold by 6 students A, B, C, D, E and F during a fair.
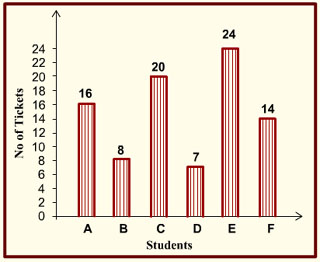
1. Average tickets sold by all the students is
- 12.5
- 14.8
- 12.1
- 13.6
2. Tickets sold by whom were at the most deviation from the average?
- B
- C
- D
- E
3. Total number of tickets sold by D, E and F is
- 47
- 46
- 45
- 44
4. What is the ratio of tickets sold by top three students to those sold by bottom three students?
- 2 : 1
- 3 : 2
- 1 : 2
- 6 : 5
5. Tickets sold by D and E together were higher by what percentage when compared to tickets sold by B and C together?
- 12%
- 10.71%
- 9.63%
- 8.87%
The following graph gives Sales, Expense and Capital of a company for a period of five years 1994 to 1998. Read the graph and answer the questions given below.
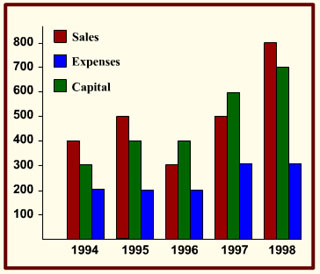
6. What has been the simple average growth rate per annum of capital between 1994 and 1998?
- 25%
- 33 1/3%
- 40%
- 130%
7. In which year was the Sales to Capital ratio the lowest?
- 1994
- 1996
- 1997
- 1998
8. What was the average per annum increase in sales (in Rs. crores) from 1994 to 1998?
- 50
- 60
- 80
- 100
9. In which year was the ratio of profits to expenses the highest?
- 1998
- 1995
- 1996
- 1997
10. In which year was the ratio of sales to Expenses the lowest?
- 1998
- 1997
- 1996
- 1995