Examination Questions in Data Interpretation - 8
Click on the Show Answer button to see the answer.
I. The following bar diagram shows the percentage of three communities - Community A, Community B and Community C in a state during the years from 2004 to 2007. Examine the bar diagram and answer the questions.
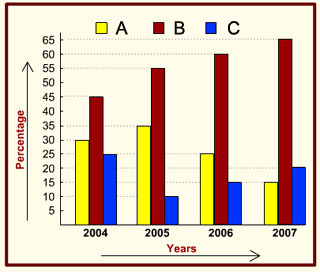
1. The ratio between the populations of Community A and Community B in 2004 was
- 2 : 3
- 3 : 4
- 3 : 5
- 1 : 2
2. If the total population of the state in 2004 was 5 lakhs, then the combined population of Community A and Community C in that year was
- 250000
- 225000
- 200000
- 275000
3. If the total population of the state in 2005 was 5 million, then the population of Community A was [ 1 million = 10,00,000]
- 1500000
- 1750000
- 2000000
- 1250000
4. If the total population in 2004 was 4,00,000 and in 2006 it was 6,00,000, by how much has the population of Community B increased in 2 years?
- increased by 25%
- increased by 50%
- increased by 100%
- remained the same
5. If the total population has doubled in 2007 when compared to 2004, what has been the effect on the population of Community A?
- remained the same
- increased by 50%
- decreased by 50%
- decreased by 15%
II. Study the following bar graph and answer the questions.
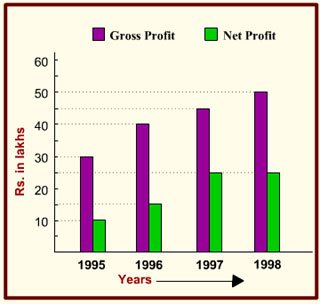
1. The year in which the gross profit is double the net profit
- 1997
- 1998
- 1995
- 1994
2. The percentage of net profit of 1995 as compared to the net profit of 1997 is
- 25%
- 30%
- 33.33%
- 40%
3. The difference of average gross profit and average net profit calculated for four years is
- Rs. 18.75 lakhs
- Rs. 19.75 lakhs
- Rs. 20.5 lakhs
- Rs. 22.5 lakhs
4. The ratio of gross profit to net profit in a year was greatest in the year
- 1994
- 1995
- 1996
- 1997
5. For the entire four years as shown, the ratio of total gross profit to total net profit is
- 13 : 4
- 11 : 6
- 11 : 5
- 9 : 4