Examination Questions in Data Interpretation - 7
Click on the Show Answer button to see the answer.
I. Study the chart carefully and answer the questions.
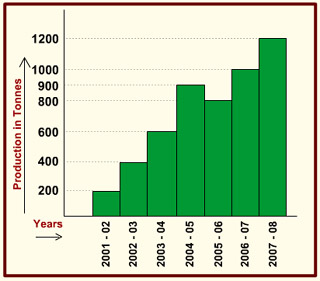
1. The production in 2006–07 in comparison to the production in 2002–03 increased by
- 110%
- 120%
- 125%
- 150%
2. The production decreased from 2004-05 to 2005–06 by
- 9 1/ 9%
- 10 1/ 9%
- 11 1/ 9%
- 8 1/ 9%
3. The year in which production increased the lowest as compared to the previous year is
- 2007 - 08
- 2006 - 07
- 2004 - 05
- 2003 - 04
4. The production from 2003–04 to 2007–08 increased by
- 75%
- 100%
- 125%
- 50%
5. The production figure for the year 2004–05 was exaggerated by 200 tonnes. What is average production for the years from 2001-02 to 2007–08 with the corrected figures?
- 550 tonnes
- 600 tonnes
- 650 tonnes
- 700 tonnes
II. The following Pie-chart shows the land distribution of a housing complex. If the total area of the complex is 5 acres, examine the pie chart and answer the questions.
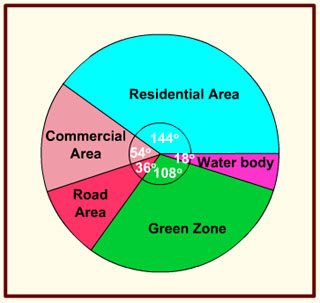
1. The ratio of area allotted for residential and road purpose is
- 1 : 4
- 4 : 1
- 3 : 8
- 8 : 3
2. The percentage of the total area allotted for water body and green zone together is
- 35%
- 30%
- 45%
- 40%
3. Land allotted for green zone is greater than that for commercial purpose by
- 3/2 acres
- 2/3 acres
- 4/3 acres
- 3/4 acres
4. The total land allotted for residential and commercial purpose is
- 2 1/4 acres
- 4 1/2 acres
- 2 3/4 acres
- 2 1/2 acres
5. 8 1/3% of total land allotted for residential purpose is now earmarked for green zone in addition to the existing green zone. What would be angular representation of increased green zone?
- 116°
- 120°
- 112°
- 124°