Examination Questions in Data Interpretation - 10
Click on the Show Answer button to see the answer.
I. The bar Graph given here shows the population (in crores) of India in various census years. Observe the graph and answer the question based on it.
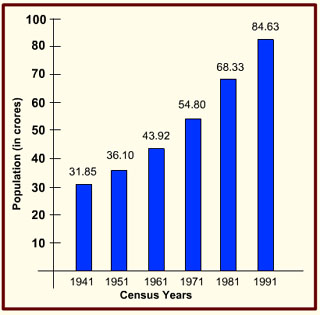
1. The per cent increase in population from 1971 to 1991 is
- 54.8
- 50
- 54.4
- 53.5
2. In which census year, the per cent increase in population is highest as compared to that in the previous census year ?
- 1951
- 1971
- 1961
- 1981
3. In which census year, the per cent increase in population is least as compared to that in the previous census year ?
- 1961
- 1951
- 1971
- 1991
4. Per year increase in population from the year 1941 to 1991 is
- 10565000
- 10665000
- 10556000
- 10456000
II. The circle graph given here shows the spending by a family on various items during the year 2012. Study the graph and answer the following questions.
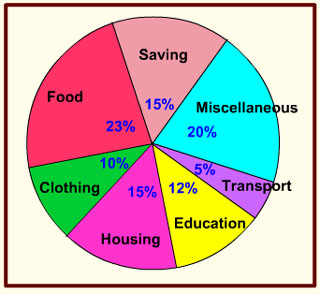
5. If the total amount spent during the year 2012 was Rs. 46000/-, the amount spent on food, was :
- Rs. 2000/-
- Rs. 10580/-
- Rs. 23000/-
- Rs. 2300/-
6. If the total amount spent was Rs. 46000/-, how much was spent on clothing and housing together?
- Rs. 11500/-
- Rs. 1150/-
- Rs. 10000/-
- Rs. 15000/-
7. The ratio of the total amount of money spent on housing to that spent on education was :
- 5 : 2
- 2 : 5
- 4 : 5
- 5 : 4
8. Graph shows that the maximum amount was spent on :
- Food
- Housing
- Clothing
- Others
9. If the total expenditure of the family for the year 2012 was Rs. 46000/-, the family saved during the year.
- Rs. 1500/-
- Rs. 15000/-
- Rs. 6900/-
- Rs. 3067/-