Examination Questions in Data Interpretation
Practice Question 1
Click on the Show Answer button to see the answer.
1. The following graph shows the expenditure incurred in bringing a book, by a magazine producer. Study the graph and answer the questions given below.
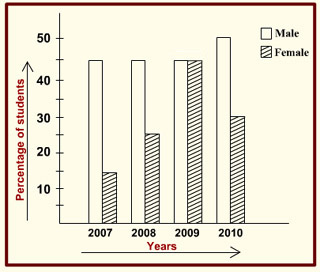
1. In which year have the maximum percentage of students passed
- 2007
- 2008
- 2009
- 2010
2. The year in which the difference of pass percentage between male and female is maximum
- 2010
- 2009
- 2008
- 2007
3. Which year has seen a decrease in the total pass percentage over the previous year?
- 2010
- 2009
- 2008
- None of the above
4. If the strength of girls remained 60 for all the 4 years, then how many more girls passed in the year 2010 when compared to 2008?
- 6
- 4
- 3
- 2
Practice Question 2
2. The questions following are based on the following bar graph. Read the graph and answer the questions.
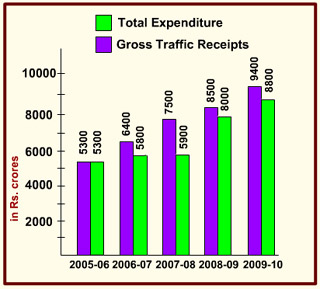
1. What is the percentage increase in the gross traffic receipts in 2007-08 as compared to 2005-06?
- 33.9%
- 41.5%
- 20.7%
- 17%
2. If profit = gross traffic receipts - total expenditure, then in 2008-09, what percentage of gross traffic receipts is the profit made?
- 5.9%
- 6.4%
- 7.2%
- 8%
3. In which year was the profit as a percentage of gross traffic receipts the highest?
- 2009-10
- 2006-07
- 2007-08
- 2006-07
4. In order to make a profit of 10% on gross traffic receipts. What should have been the gross traffic receipts (in Rs. crores) in 2006-07, total expenditure remaining the same?
- 5,667
- 5,876
- 6,444
- 7,667
5. By what amount ( in Rs. crores) has the expenditure increased over the period 2005-06 to 2009-10?
- 4,100
- 3,900
- 3,850
- 3,500
Practice Question 3
3. Study the chart carefully and answer the questions.
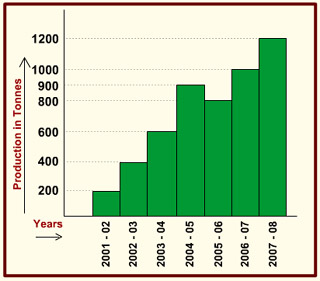
1. The production in 2006–07 in comparison to the production in 2002–03 increased by
- 110%
- 120%
- 125%
- 150%
2. The production decreased from 2004-05 to 2005–06 by
- 9 1/ 9%
- 10 1/ 9%
- 11 1/ 9%
- 8 1/ 9%
3. The year in which production increased the lowest as compared to the previous year is
- 2007 - 08
- 2006 - 07
- 2004 - 05
- 2003 - 04
4. The production from 2003–04 to 2007–08 increased by
- 75%
- 100%
- 125%
- 50%
5. The production figure for the year 2004–05 was exaggerated by 200 tonnes. What is average production for the years from 2001-02 to 2007–08 with the corrected figures?
- 550 tonnes
- 600 tonnes
- 650 tonnes
- 700 tonnes
Practice Question 4
4. The following Pie-chart shows the land distribution of a housing complex. If the total area of the complex is 5 acres, examine the pie chart and answer the questions.
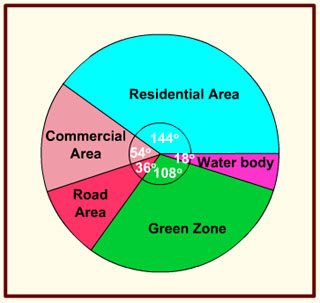
1. The ratio of area allotted for residential and road purpose is
- 1 : 4
- 4 : 1
- 3 : 8
- 8 : 3
2. The percentage of the total area allotted for water body and green zone together is
- 35%
- 30%
- 45%
- 40%
3. Land allotted for green zone is greater than that for commercial purpose by
- 3/2 acres
- 2/3 acres
- 4/3 acres
- 3/4 acres
4. The total land allotted for residential and commercial purpose is
- 2 1/4 acres
- 4 1/2 acres
- 2 3/4 acres
- 2 1/2 acres
5. 8 1/3% of total land allotted for residential purpose is now earmarked for green zone in addition to the existing green zone. What would be angular representation of increased green zone?
- 116°
- 120°
- 112°
- 124°
Practice Question 5
5. The following bar diagram shows the percentage of three communities - Community A, Community B and Community C in a state during the years from 2004 to 2007. Examine the bar diagram and answer the questions.
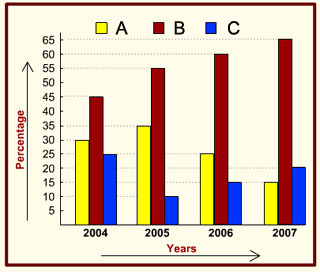
1. The ratio between the populations of Community A and Community B in 2004 was
- 2 : 3
- 3 : 4
- 3 : 5
- 1 : 2
2. If the total population of the state in 2004 was 5 lakhs, then the combined population of Community A and Community C in that year was
- 250000
- 225000
- 200000
- 275000
3. If the total population of the state in 2005 was 5 million, then the population of Community A was [ 1 million = 10,00,000]
- 1500000
- 1750000
- 2000000
- 1250000
4. If the total population in 2004 was 4,00,000 and in 2006 it was 6,00,000, by how much has the population of Community B increased in 2 years?
- increased by 25%
- increased by 50%
- increased by 100%
- remained the same
5. If the total population has doubled in 2007 when compared to 2004, what has been the effect on the population of Community A?
- remained the same
- increased by 50%
- decreased by 50%
- decreased by 15%
Practice Question 6
6. Study the following bar graph and answer the questions.
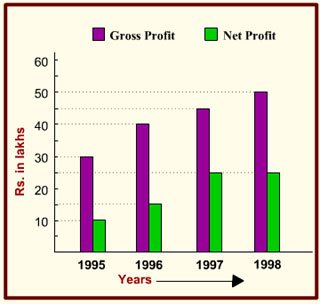
1. The year in which the gross profit is double the net profit
- 1997
- 1998
- 1995
- 1994
2. The percentage of net profit of 1995 as compared to the net profit of 1997 is
- 25%
- 30%
- 33.33%
- 40%
3. The difference of average gross profit and average net profit calculated for four years is
- Rs. 18.75 lakhs
- Rs. 19.75 lakhs
- Rs. 20.5 lakhs
- Rs. 22.5 lakhs
4. The ratio of gross profit to net profit in a year was greatest in the year
- 1994
- 1995
- 1996
- 1997
5. For the entire four years as shown, the ratio of total gross profit to total net profit is
- 13 : 4
- 11 : 6
- 11 : 5
- 9 : 4
Practice Question 7
7. The bar graph, given below, shows the number of tickets sold by 6 students A, B, C, D, E and F during a fair.
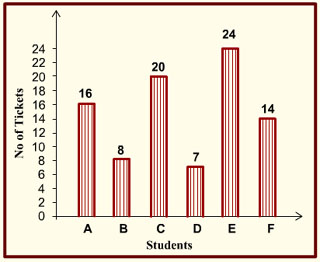
1. Average tickets sold by all the students is
- 12.5
- 14.8
- 12.1
- 13.6
2. Tickets sold by whom were at the most deviation from the average?
- B
- C
- D
- E
3. Total number of tickets sold by D, E and F is
- 47
- 46
- 45
- 44
4. What is the ratio of tickets sold by top three students to those sold by bottom three students?
- 2 : 1
- 3 : 2
- 1 : 2
- 6 : 5
5. Tickets sold by D and E together were higher by what percentage when compared to tickets sold by B and C together?
- 12%
- 10.71%
- 9.63%
- 8.87%
Practice Question 8
8. The following graph gives Sales, Expense and Capital of a company for a period of five years 1994 to 1998. Read the graph and answer the questions given below.
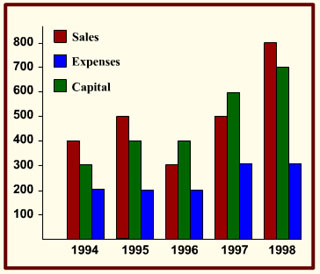
6. What has been the simple average growth rate per annum of capital between 1994 and 1998?
- 25%
- 33 1/3%
- 40%
- 130%
7. In which year was the Sales to Capital ratio the lowest?
- 1994
- 1996
- 1997
- 1998
8. What was the average per annum increase in sales (in Rs. crores) from 1994 to 1998?
- 50
- 60
- 80
- 100
9. In which year was the ratio of profits to expenses the highest?
- 1998
- 1995
- 1996
- 1997
10. In which year was the ratio of sales to Expenses the lowest?
- 1998
- 1997
- 1996
- 1995
Practice Question 9
9. The bar Graph given here shows the population (in crores) of India in various census years. Observe the graph and answer the question based on it.
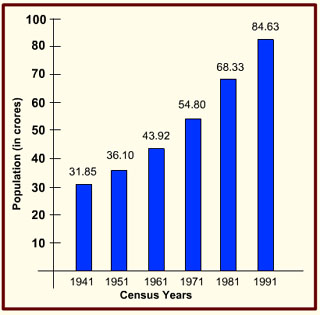
1. The per cent increase in population from 1971 to 1991 is
- 54.8
- 50
- 54.4
- 53.5
2. In which census year, the per cent increase in population is highest as compared to that in the previous census year ?
- 1951
- 1971
- 1961
- 1981
3. In which census year, the per cent increase in population is least as compared to that in the previous census year ?
- 1961
- 1951
- 1971
- 1991
4. Per year increase in population from the year 1941 to 1991 is
- 10565000
- 10665000
- 10556000
- 10456000
Practice Question 10
10. The circle graph given here shows the spending by a family on various items during the year 2012. Study the graph and answer the following questions.
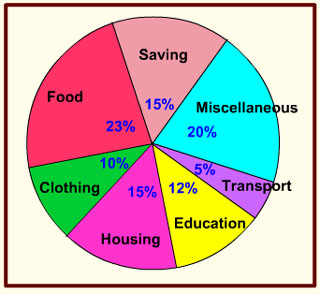
5. If the total amount spent during the year 2012 was Rs. 46000/-, the amount spent on food, was :
- Rs. 2000/-
- Rs. 10580/-
- Rs. 23000/-
- Rs. 2300/-
6. If the total amount spent was Rs. 46000/-, how much was spent on clothing and housing together?
- Rs. 11500/-
- Rs. 1150/-
- Rs. 10000/-
- Rs. 15000/-
7. The ratio of the total amount of money spent on housing to that spent on education was :
- 5 : 2
- 2 : 5
- 4 : 5
- 5 : 4
8. Graph shows that the maximum amount was spent on :
- Food
- Housing
- Clothing
- Others
9. If the total expenditure of the family for the year 2012 was Rs. 46000/-, the family saved during the year.
- Rs. 1500/-
- Rs. 15000/-
- Rs. 6900/-
- Rs. 3067/-