Practice Questions in Data Interpretation
Practice Question 1
Click on the Show Answer button to see the answer.
1. The following graph shows the expenditure incurred in bringing a book, by a magazine producer. Study the graph and answer the questions given below.
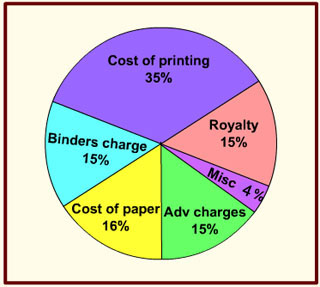
1. What should be the central angle of the sector for the cost of the paper ?
- 57.6°
- 54.4°
- 56.7°
- 54.8°
2. If the miscellaneous charges are Rs. 6,000, the cost of paper is
- Rs. 12,000
- Rs. 18,000
- Rs. 15,000
- Rs. 24,000
3. If 5500 copies are published, miscellaneous expenditures amount to Rs. 1,848, find the cost price of 1 copy.
- Rs. 10.40
- Rs. 9.40
- Rs. 12.40
- Rs. 8.40
4. The cost of printing 100 copies was Rs. 10000/-, but the miscellaneous expenses just got doubled. What percentage of the total expenses are miscellaneous expenses?
- 6.58%
- 7.24%
- 7.69%
- 8.51%
Practice Question 2
2. The following graph shows the Profits and Losses, (in thousand rupees) in a business for the years 2006-2011. Study the graph and answer the questions.
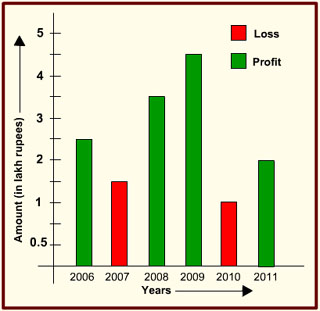
1. Which year exhibits the greatest change (positive or negative) in relation to the previous year?
- 2007
- 2008
- 2009
- 2010
2. The amount of total loss incurred during 2006-2011 is
- 3 lakh rupees
- 2.5 lakh rupees
- 1.5 lakh rupees
- 2 lakh rupees
3. The ratio of the maximum profit earned to the minimum loss suffered is
- 4 : 3
- 3 : 4
- 9 : 2
- 2 : 9
4. If the loss is x % of the profit for the years under study, then x is
- 15
- 25
- 20
- 19
5. What was the net loss or profit made by the company in 6 years?
- 11 lakhs
- 10.5 lakhs
- 12.5 lakhs
- 10 lakhs
Practice Question 3
3. The given histogram shows the average pocket money received by 60 students for a span of one month. Study the diagram and answer the questions given below.
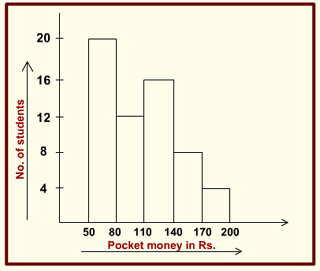
1. Maximum number of students received pocket money between
- 50 - 80
- 140 - 170
- 80 - 110
- 110 - 140
2. The number of students who received pocket money up to Rs. 140 is
- 20
- 32
- 48
- 56
3. The number of students who received pocket money above Rs. 80 and upto Rs. 170 is
- 30
- 36
- 28
- 40
4. What percentage of students receive pocket money between Rs. 140 and Rs. 170 when compared to those receiving between Rs. 50 and Rs. 80?
- 50
- 36
- 44
- 40
5. If students receiving pocket money above Rs. 110 are from rich families and others from poor families, then what is the ratio of rich students to poor students?
- 7 : 8
- 5 : 6
- 14 : 15
- 8 : 7
Practice Question 4
4. The number of mobile simcards in 4 states are given in multiple bar diagrams. Study the diagram and answer the questions.
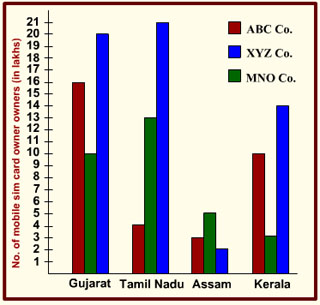
1. In Assam, the ratio of XYZ simcard and MNO simcard sold is :
- 3 : 2
- 2 : 5
- 5 : 2
- 2 : 3
2. Which state has the largest number of owners of XYZ simcard?
- Tamil Nadu
- Gujarat
- Kerala
- Assam
3. Average of simcard sold in the four states in lakhs is
- 30.25
- 40.5
- 35
- 33.75
4. The range of ABC simcard sold in the 4 states in lakhs is :
- 12
- 15
- 14
- 13
5. Of all the simcards sold in all the four states, the number of simcards sold in Gujarat is (approx)
- 40%
- 38%
- 35%
- 42%
Practice Question 5
5. The following pie-chart shows the details of 1500 employees working in a company in various scales and also the break-up of 800 male employees across the scales. Study the pie-charts carefully and answer the questions.
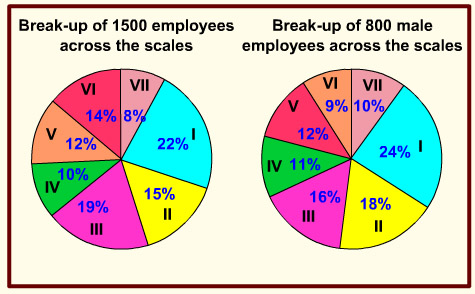
1. How many females are working in scale V?
- 180
- 144
- 96
- 84
2. The male-female ratio working in scale VII is
- 1 : 2
- 2 : 1
- 2 : 3
- 3 : 2
3. The scales in which the number of working females is the same are
- I and VI
- I and III
- III and VI
- only III
4. The number of scales in which the female workforce is less than the average female workforce is
- 5
- 2
- 3
- None of these
5. Had the total number of employees working in the company been 1600 (800 male, 800 female) and pie charts of break-up across the scales the same, the percentage increase or decrease of female workforce in scale VII is
- 10% decrease
- 15% increase
- 20% decrease
- 20% increase
Practice Question 6
6. Study the following histogram and answer the questions given below.
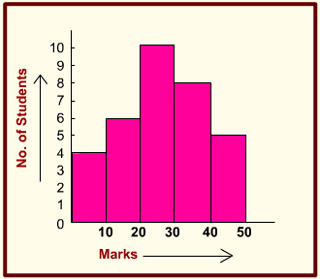
1. The total number of students involved in the data is
- 33
- 32
- 43
- 42
2. If students getting more than 30 marks are considered passed, then what percentage of total students have passed (assume that all students in the interval 30 to 40 have scored more than 30 marks)?
- 45
- 39
- 35
- 30
3. If 35 is the qualifying marks for promotion to the next grade and only 2 students in the 30 - 40 range scored above 35, then what is percentage of students who failed to qualify?
- 52
- 65
- 78
- 83
4. The ratio of the students obtaining marks in the first and the last interval is
- 5 : 4
- 6 : 5
- 4 : 5
- 3 : 4
5. The least number of students got the marks in the interval
- 40 - 50
- 20 - 30
- 10 - 20
- 0 - 10
Practice Question 7
7. Given here is a multiple bar diagram depicting the changes in the students strength of a college in four faculties from 2007-08 to 2009-10. Study the diagram and answer the questions.
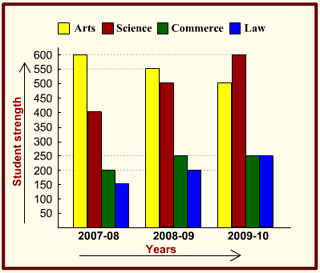
1. In which faculty was there a regular decrease in students strength ?
- Arts
- Science
- Commerce
- Law
2. The percentage of students in Science faculty in 2007 – 08 was
- 26.9
- 27.8
- 29.6
- 30.2
3. The total students strength in 2008 – 09 was how many times that of Commerce students in the same year ?
- 3
- 4
- 5
- 6
4. What was the percent increase in Science students from the year 2007-08 to 2009 – 10 ?
- 50
- 66 2/3
- 75
- 150
5. In which two years was the strength of non-science (Arts, Commerce and Law) students the same?
- 2007-08 and 2008-09
- 2008-09 and 2009-10
- 2007-08 and 2009-10
- None
Practice Question 8
8. The pie-graph given below shows the break-up of the cost of construction of a house. Assuming that the total cost of construction is Rs. 6,00,000, answer the questions.
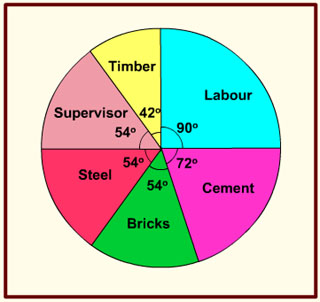
1. The amount spent on cement is
- Rs. 2,00,000
- Rs. 1,60,000
- Rs. 1,20,000
- Rs. 1,00,000
2. The amount spent on labour exceeds the amount spent on steel by
- 5% of the total cost
- 10% of the total cost
- 12% of the total cost
- 15% of the total cost
3. The amount spent on cement, steel and supervision is what percent of the total cost of construction ?
- 40%
- 45%
- 50%
- 55%
4. The amount spent on labour exceeds the amount spent on supervision by
- Rs. 2,00,000
- Rs. 16,000
- Rs. 1,20,000
- Rs. 60,000
5. The amount spent on Timber is
- Rs. 60,000
- Rs. 90,000
- Rs. 70,000
- Rs. 36,000
Practice Question 9
9. The following pie-chart shows the marks scored by a student in different subjects – viz. Physics (Ph), Chemistry (Ch), Mathematics (M), Social Science (SS) and English (E) in an examination. Assuming that total marks obtained for the examination is 810, answer the questions.
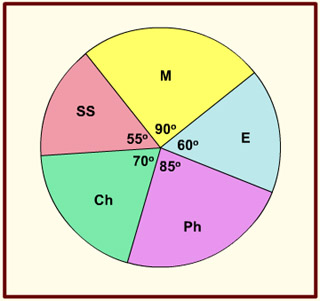
1. The subject in which the student obtained 135 marks is
- Chemistry
- English
- Mathematics
- Physics
2. The marks obtained in English, Physics and Social Science exceed the marks obtained in Mathematics and Chemistry by
- 10 1/9%
- 11%
- 11 1/9%
- 10%
3. The difference of marks between Physics and Chemistry is same as that between
- Mathematics and English
- English and Social Science
- Physics and English
- Chemistry and Social Science
4. The marks obtained in Mathematics and Chemistry exceed the marks obtained in Physics and Social Science by
- 40
- 45
- 50
- 30
5. The average of marks obtained in Mathematics, English and Chemistry is
- 165
- 200
- 155
- 148
Practice Question 10
10. The graph shows Income and Expenditure of a company. Study the graph and answer the questions.
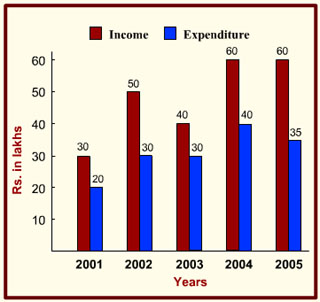
1. The expenditure from 2002 to 2004 increased by
- 33 1/3%
- 40%
- 10%
- 20%
2. The income in 2003 was equal to the expenditure in the year
- 2003
- 2004
- 2000
- 2001
3. The profit was maximum in the year
- 2003
- 2004
- 2005
- 2002
4. The difference in profit between 2001 and 2002 is
- Rs. 25 lakhs
- No difference
- Rs. 10 lakhs
- Rs. 20 lakhs
5. The number of years in which the income exceeds the average income is
- three
- four
- one
- two