Examination Questions in Data Interpretation - 5
Click on the Show Answer button to see the answer.
I. Given here is a multiple bar diagram depicting the changes in the students strength of a college in four faculties from 2007-08 to 2009-10. Study the diagram and answer the questions.
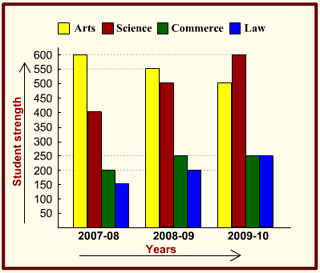
1. In which faculty was there a regular decrease in students strength ?
- Arts
- Science
- Commerce
- Law
2. The percentage of students in Science faculty in 2007 – 08 was
- 26.9
- 27.8
- 29.6
- 30.2
3. The total students strength in 2008 – 09 was how many times that of Commerce students in the same year ?
- 3
- 4
- 5
- 6
4. What was the percent increase in Science students from the year 2007-08 to 2009 – 10 ?
- 50
- 66 2/3
- 75
- 150
5. In which two years was the strength of non-science (Arts, Commerce and Law) students the same?
- 2007-08 and 2008-09
- 2008-09 and 2009-10
- 2007-08 and 2009-10
- None
II. The pie-graph given below shows the break-up of the cost of construction of a house. Assuming that the total cost of construction is Rs. 6,00,000, answer the questions.
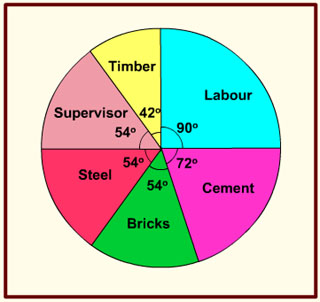
6. The amount spent on cement is
- Rs. 2,00,000
- Rs. 1,60,000
- Rs. 1,20,000
- Rs. 1,00,000
7. The amount spent on labour exceeds the amount spent on steel by
- 5% of the total cost
- 10% of the total cost
- 12% of the total cost
- 15% of the total cost
8. The amount spent on cement, steel and supervision is what percent of the total cost of construction ?
- 40%
- 45%
- 50%
- 55%
9. The amount spent on labour exceeds the amount spent on supervision by
- Rs. 2,00,000
- Rs. 16,000
- Rs. 1,20,000
- Rs. 60,000
10. The amount spent on Timber is
- Rs. 60,000
- Rs. 90,000
- Rs. 70,000
- Rs. 36,000