Examination Questions in Data Interpretation - 4
Click on the Show Answer button to see the answer.
1. The following pie-chart shows the details of 1500 employees working in a company in various scales and also the break-up of 800 male employees across the scales. Study the pie-charts carefully and answer the questions.
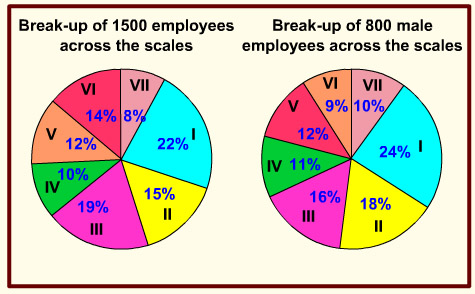
1. How many females are working in scale V?
- 180
- 144
- 96
- 84
2. The male-female ratio working in scale VII is
- 1 : 2
- 2 : 1
- 2 : 3
- 3 : 2
3. The scales in which the number of working females is the same are
- I and VI
- I and III
- III and VI
- only III
4. The number of scales in which the female workforce is less than the average female workforce is
- 5
- 2
- 3
- None of these
5. Had the total number of employees working in the company been 1600 (800 male, 800 female) and pie charts of break-up across the scales the same, the percentage increase or decrease of female workforce in scale VII is
- 10% decrease
- 15% increase
- 20% decrease
- 20% increase
2. Study the following histogram and answer the questions given below.
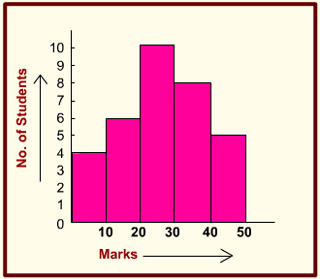
1. The total number of students involved in the data is
- 33
- 32
- 43
- 42
2. If students getting more than 30 marks are considered passed, then what percentage of total students have passed (assume that all students in the interval 30 to 40 have scored more than 30 marks)?
- 45
- 39
- 35
- 30
3. If 35 is the qualifying marks for promotion to the next grade and only 2 students in the 30 - 40 range scored above 35, then what is percentage of students who failed to qualify?
- 52
- 65
- 78
- 83
4. The ratio of the students obtaining marks in the first and the last interval is
- 5 : 4
- 6 : 5
- 4 : 5
- 3 : 4
5. The least number of students got the marks in the interval
- 40 - 50
- 20 - 30
- 10 - 20
- 0 - 10