Examination Questions in Data Interpretation
Click on the option you think is right and then check by clicking on the Show Answer button. You can change your option as many times as you like.
The bar graph, given below, shows the number of tickets sold by 6 students A, B, C, D, E and F during a fair.
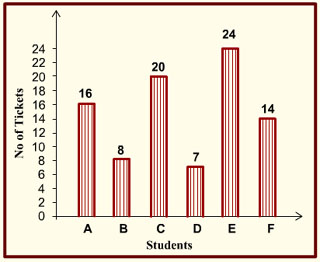
1. Average tickets sold by all the students is
- 12.5
- 14.8
- 12.1
- 13.6
2. Tickets sold by whom were at the most deviation from the average?
- B
- C
- D
- E
3. Total number of tickets sold by D, E and F is
- 47
- 46
- 45
- 44
4. What is the ratio of tickets sold by top three students to those sold by bottom three students?
- 2 : 1
- 3 : 2
- 1 : 2
- 6 : 5
5. Tickets sold by D and E together were higher by what percentage when compared to tickets sold by B and C together?
- 12%
- 10.71%
- 9.63%
- 8.87%