Examination Questions in Data Interpretation - 5
Click on the option you think is right and then check by clicking on the Show Answer button. You can change your option as many times as you like.
Given here is a multiple bar diagram depicting the changes in the students strength of a college in four faculties from 2007-08 to 2009-10. Study the diagram and answer the questions.
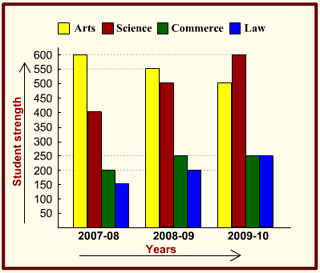
1. In which faculty was there a regular decrease in students strength ?
- Arts
- Science
- Commerce
- Law
2. The percentage of students in Science faculty in 2007 – 08 was
- 26.9
- 27.8
- 29.6
- 30.2
3. The total students strength in 2008 – 09 was how many times that of Commerce students in the same year ?
- 3
- 4
- 5
- 6
4. What was the percent increase in Science students from the year 2007-08 to 2009 – 10 ?
- 50
- 66 2/3
- 75
- 150
5. In which two years was the strength of non-science (Arts, Commerce and Law) students the same?
- 2007-08 and 2008-09
- 2008-09 and 2009-10
- 2007-08 and 2009-10
- None