Examination Questions in Data Interpretation - 2
Click on the option you think is right and then check by clicking on the Show Answer button. You can change your option as many times as you like.
The pass percentage for an examination in a school is shown in the bar diagram below, for males and females separately for four years. Study the diagram and answer the questions given below.
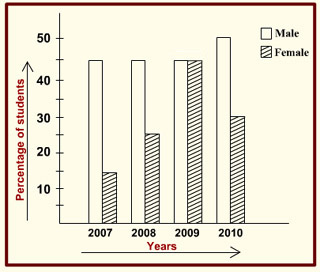
1. In which year have the maximum percentage of students passed
- 2007
- 2008
- 2009
- 2010
2. The year in which the difference of pass percentage between male and female is maximum
- 2010
- 2009
- 2008
- 2007
3. Which year has seen a decrease in the total pass percentage over the previous year?
- 2010
- 2009
- 2008
- None of the above
4. If the strength of girls remained 60 for all the 4 years, then how many more girls passed in the year 2010 when compared to 2008?
- 6
- 4
- 3
- 2
5. The strength of girls in 2007 was 60 but the strength doubled in 2008. How many more girls passed in the year 2008 when compared to 2007?
- 20
- 21
- 22
- 23